Commander provides the ability to monitor Azure memory usage. While Azure collects CPU, network and disk usage metrics, it doesn't provide memory usage metrics by default. You can enable memory usage monitoring so that:
- VM owners can monitor memory usage.
- Commander can issue memory rightsizing recommendations for the VM.
During provisioning, when you enable memory usage monitoring for a new VM, Commander will attach an extension to the VM, which will send the data to a storage account that you choose.
The Commander equivalent for both the Azure memory metrics for Windows and Linux are:
To enable memory usage monitoring for new Azure VMs, the following conditions must be met:
- Memory usage monitoring must be enabled as described in this topic.
- The credentials used to add the Azure subscription to Commander must have read/write permissions on the storage account.
- The deployed VM must have internet access, so that memory metrics data can be sent to the storage account.
- The Azure Diagnostics extension must be installed on the deployed VM. For more information, see Azure Diagnostics extension overview.
- The Azure Diagnostics extension for Linux requires that Python 2 is installed on the deployed VM, and the
python2executable file must be aliased topython. For more information, see Python requirement.
Enable memory usage monitoring
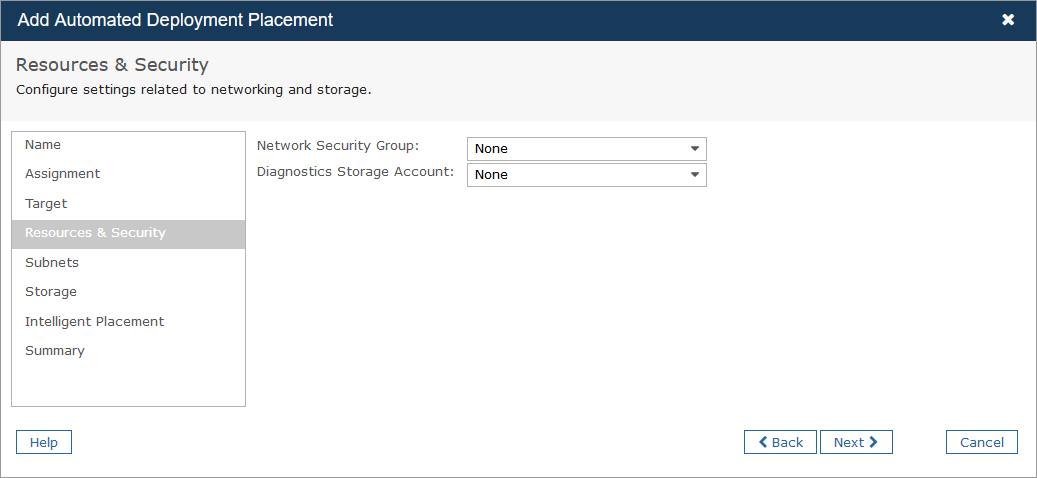
During configuration, specify where to store the data that's coming from Azure. You create a place to save the memory usage data by selecting a storage account in the destination configuration.

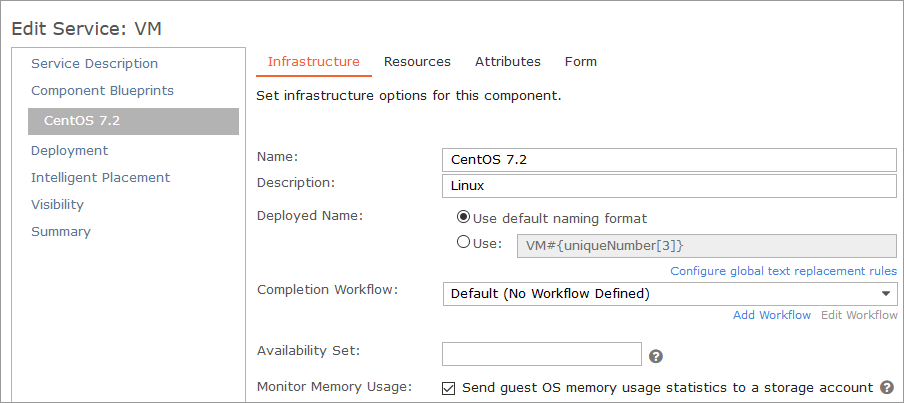
To allow Commander to send memory metrics to the storage account you just created, enable the Monitor Memory Usage checkbox for the service catalog entry. You can find this option on the Infrastructure tab of the Component Blueprints page.
See Add Azure Services to the Catalog for more information.

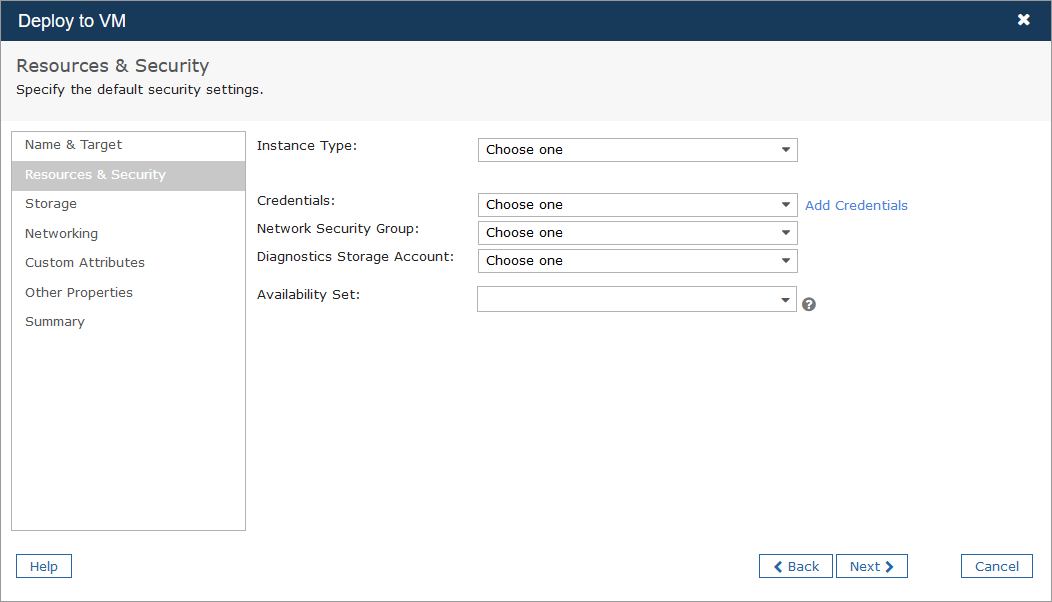
In the manual provisioning wizard, choose the storage account that will be used to save the data.

You can also turn on memory monitoring at any time in the Azure portal and Commander will retrieve metrics. For more information, see the Microsoft tutorial Monitor a Windows virtual machine in Azure . This is useful to view the metrics of individual VMs, but isn't practical for obtaining metrics of a large number of VMs.
